PowerPoint Tips Blog | |
August 21, 2007
Display a quarter-size slide show viewDo you often switch back and forth between Normal and Slide Show views? I do. I want to see how that animation or slide transition will look and so I switch over to check. A better way is to display both views simultaneously. Yes, you can do that, by displaying Slide Show view at quarter-size.

That little slide show view really works, too. You can click on it to advance the slides, and press Esc to close it.
You won't believe how easy it is to do this. Just press Ctrl as you click the Slide Show view icon ![]() That's all there is to it! Then you can see both views at the same time.
That's all there is to it! Then you can see both views at the same time.
Unfortunately, you can't move the little Slide Show view and it does hide a good part of your working area, but it's just a window, so as soon as you need to work in Normal view, click in that view and your Slide Show view disappears so that you can work.
But it isn't gone; you've just minimized it and you can display it on top again by clicking its button on the Windows taskbar.
Even cooler, if you have a wide screen, you can make your Normal view window narrower and display both windows side by side. Then you have your cake and eat it too, easily going back and forth between the two views.
So, next time you want to check something in Slide Show view, instead of pressing F5 or Shift-F5 (which starts Slide Show view at the current slide), or clicking the Slide Show icon, press Ctrl and use that quarter-size view.
August 21, 2007
Have a conversation with your audienceA presentation implies that you have a serious amount of content to impart at once to your audience. If not, you're just having a meeting or a discussion. But you can structure your presentation as a conversation in many ways.
Why have a conversation?
First of all, why have a conversation at all? There are several answers:
- You get feedback from the audience: Did they understand? Are they interested? Do they want to go in a different direction? Do they have an objection? Do they disagree? This feedback is very useful, whether you are selling a product, a service, or an idea.
- The audience buys into your message because members become part of it
- You show respect for the audience's point of view. As a result, the audience is more likely to accept what you're saying.
- You can gather important information from the audience, such as their names and contact information, their concerns, their level of experience, and so on.
Maybe you can think of other reasons.
The Q&A
The most common way to have a conversation with the audience is to have a Question & Answer session at the end. Even this simple technique is very useful. A question that one member asks may be lurking in the minds of others, so your answer is useful to many. At this time, you can resolve doubts, clarify misunderstandings, and so on. The advantage is that you have control over most of the presentation.
Give them free rein
Another option is to let audience members ask questions throughout the presentation. This method allows you to resolve doubts and misunderstandings immediately so audience members can be with you for the rest of the presentation. Often, some problem arises in someone's mind and the he or she practically doesn't hear the rest of what you say because the problem takes precendence.
(Have you noticed that some people don't listen very well? One reason is that they immediately think of how they will respond to you and then focus on their concerns, rather than on you.)
Also, you may get immediate feedback so that you avoid going in a non-fruitful direction, get a chance to include points that people want to hear, and discover if you are speaking over or beneath their expertise.
On the other hand, taking questions throughout can disturb the flow of ideas that you planned. Sometimes that's a good thing, sometimes it isn't. Other audience members may feel that the presentation is being interrupted and become impatient.
Give a little, take a little
A third alternative is a blend of the previous two. You can present some ideas at the start of your presentation, get some questions and feedback, and then use that feedback to adjust the rest of your presentation. Finally, you can hold a Q&A session. Because you started a conversation at the beginning, audience members should feel more free to simply listen.
Consider the situation
The technique you choose depends on the situation; there is no one right way to go. The size of the audience is a simple parameter that should affect your choice. With a large audience, it may be unwieldy to take questions throughout and a few people may dominate the floor. With a small audience, an ongoing conversation throughout may work better. If you're selling a product or service, you certainly want to allow your audience to voice concerns, ideas, and directions.
Allow the presentation to branch out
You can set up a presentation that allows you to respond to audience feedback. This is sometimes called a non-linear presentation. You can hyperlinks to allow you go quickly go anywhere in the presentation, to other presentations, or even to Web sites. If someone says, "But how do your copiers interface with our database?" you can click a link and say, "That's a good question, I have some information on that here." My tip, "Designing a Web-Style Presentation" offers one method to do this. The Custom Shows feature is another method. In this way, you can make your presentation more of a conversation than a 1-way show.
Use quiz and feedback techniques
You can incorporate feedback mechanisms into PowerPoint that will work even with a self-running presentation. Quizzes in PowerPoint let viewers respond to the presentation, whether by answering questions on the content. I cover some quiz techniques here.
I also have a tutorial on creating a quiz and a Jeopardy-like game in PowerPoint, which you can download.
Finally, you can collect information (name and e-mail address, for example) or get feedback from people who view a PowerPoint presentation on their own. (Did they like it? Was it useful?) In my tip, "Collect information or feedback," I explain how.
People love a conversation
Start thinking of your presentations as conversations and use some of the techniques described here. Your audiences will appreciate it!
August 11, 2007
Crop around an imageSometimes, you want to crop around an image with a complex shape. Most people do this in Adobe® Photoshop® or another image-editing program, but you can do it in PowerPoint if you don't have or know another program.
If you have PowerPoint for the Mac, the Picture toolbar has two lasso buttons that you can use. These are similar to the lasso tools found in image-editing programs and I wish that PowerPoint for the PC had them. But if you're on a PC, there's another option. (Unfortunately, this technique doesn't work in PowerPoint 2007 because the image becomes distorted.)
Let's say you'd like to crop around this photo, to remove the background.

Follow these steps:
- Insert the image that you want to use. It needs to be a separate file, rather than pasted from the Clipboard.
- Crop the image so that the part you want to keep is centered. This is very important; otherwise, the end result will be shifted or skewed.
- Increase the zoom to at least 100%, more for a complex outline. Make sure that the entire image is on the screen. (Closing an open task bar helps.)
- From the Drawing toolbar, choose AutoShapes>Lines>Freeform. (In 2007, use the Insert tab and click Shapes. Choose the Freeform button in the Lines section.)
- Click anywhere along the edge where you want to crop and drag around the image (with the mouse button held down). For straight lines, you can release the mouse button and click at the end of the line. When you're back to the start point, release the mouse button and the freeform should complete itself.

Note: It doesn't have to be perfect; you can edit it later. Also, I must admit that using a mouse is somewhat awkward and I used instead a Wacom tablet with a stylus. This is the ideal tool for the job.
- Double-click the freeform to open the Format AutoShape dialog box. (In 2007, this displays the Format tab.) Change the fill to No Fill, but leave the outline alone. (For this tutorial, I made the outline thicker, so you could see it clearly.)

- Now you'll see some places that need to be adjusted. For example, on the right side of the image, the line is too far away from the collar and shoulder.
- Select the freeform and on the Drawing toolbar, choose Draw>Edit Points. (In 2007, click the Format tab and choose Edit Shape>Edit Points. You now see lots of dots around the outline.
- To adjust a point, click it and drag it to the desired location. You can also right-click a point that you don't want and choose Delete Point. Continue until your freeform closely follows the outline of the image.

- Delete the image.
- Double-click the freeform. Click the Fill Color drop-down list and choose Fill Effects. Click the Picture tab. (In 2007, click Shape Fill on the Format tab and choose Picture.) Choose the picture you chose before and click Insert.
- The picture now fills the freeform. Because the freeform is the shape of the image (minus the background that you don't want), the result is to crop the picture!
- Format the freeform again and set the outline to No Outline.
August 4, 2007
Create effective graphs/charts
Graphs (called charts in PowerPoint) are an important part of many presentations, especially ones with financial data. In this tip, I include the basics for creating a readable, effective graph.
For a special technique, read another tip, " Push PowerPoint charting options to the limit."
First, some basic steps:
- Make sure that your data is not too complex. Often, you can split one chart into two to make the point more clearly.
- Choose the right chart type! Data that is appropriate for a column chart doesn't work with a pie chart, and vice versa.
- It's often useful to add an arrow or callout to the chart to point out important data or trends.
Once you have your chart, know that PowerPoint's default formatting is never acceptable. That's right, never. So you might as well learn how to change the formatting. Here you see the default chart using the blank template.
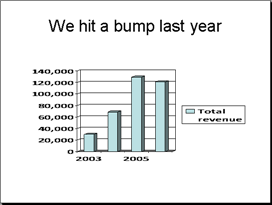
Here are the problems:
- The 3D effect is confusing. Does the front or the back of the column represent the actual number?
- You don't need the legend on the right, because the title provides the information. The legend also forces the graph to fit into a smaller space.
- The bars help guage the value, but they're ugly and distracting.
- The bars are too far apart from each other, which makes see the trend more difficult.
- The bars could look more interesting!
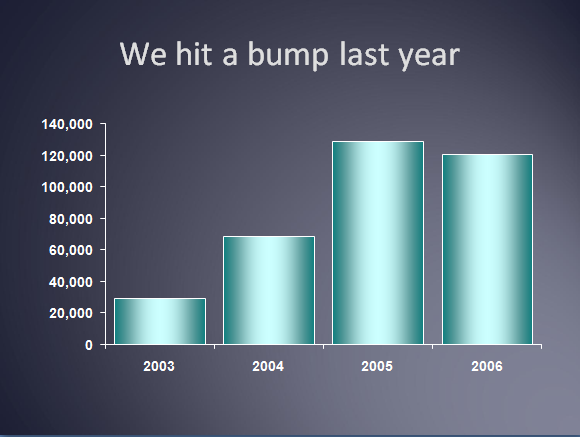
Here is one way you could change the chart:
- Double-click the chart to open it for editing.
- Choose Chart>Chart Type. Choose the first chart sub-type (a 2D option) and click OK. The actual values are much more apparent now.
- Click the legend on the right to select it and press Delete. Your graph now takes up the entire chart area.
- Click one of the gridlines, and press Delete. The background is now uncluttered.
- Click one of the columns, right-click the column, and choose Format Data Series. Click the Options tab. In the Gap Width text box, reduce the value to 20. The columns are now closer together.

- Click the Patterns tab. In the Area section, click Fill Effects. On the Gradient tab of the Fill Effects dialog box, Choose the Two Colors option. Click the Color 1 and Color 2 drop-down lists and choose two colors that you like, that match the rest of the presentation, and that go well with each other. I chose Light Turquoise and Teal. In the Shading Styles section, choose Vertical and then choose the variant with the lighter color in the middle. Click OK twice. The columns now have a subtle 3D effect without being confusing.
Here's the final result, with a background applied.
June 29, 2007
10% off my next Webinar: Designing PowerPoint Slides Like a Pro!
Tuesday Sept 18 at 1-2 PM , 2007
1 pm ET (12 Noon CT, 11 am MT, 10 am PT); 60 minutes
10% discount available!
Convey your message and engage the audience
Are your PowerPoint presentations effective? Do they clearly convey your message and engage your audience?
Or, are you guilty of creating boring and confusing slides?
You can learn how to create powerful presentations that are a pleasure to look at. Turn your next presentation into a professional slide show using these simple techniques:
- Secrets of the pros that save time and create professional results.
- Best practices for fonts and colors. Learn which fonts and colors look best and which to avoid.
- 5 surefire backgrounds you can customize on your own.
- Layout techniques that always look good even if you are not an artist.
- 7 steps to better images.
- Ditch the bullets—and improve your presentations at the same time.
- Present charts, tables, and diagrams that people can actually understand.
PLUS! Get immediate answers to your Microsoft PowerPoint questions during the live Q&A session. It’s like having your own virtual presentation and PowerPoint expert on site!
This seminar is hosted by Eli Journals, the publisher of the monthly Inside PowerPoint newsletter.
Special Offer! Get 10% off the price of the seminar. Enter the code 10%offppt in the Enter Coupon Code box.
To sign up, go to AudioEducator.com
June 29, 2007
Web seminar, "Creating Interactive Quizzes in PowerPoint" a success!
Last week, on June 20th, I delivered a webinar to over 75 participants -- and 40 more people paid for the CD! This was one of the largest webinars ever for Eli Journals/AudioEducator.com. For that webinar, I created a tutorial covering two of the techniques -- a simple quiz and a Jeopardy-like game. You can download that tutorial for free here! If you would like to see the entire recording of the webinar, you can buy the CD from the sponsor's Web site. Scroll down to the bottom of the page to see the option to buy the CD.
June 29, 2007
June, 2007 Resource of the Month - The PowerPoint FAQ
The PowerPoint FAQ is one of the most widely visited sites in the PowerPoint world. Steve Rindsberg, a PowerPoint MVP, has answered hundreds of PowerPoint-related questions, with the most incredible thoroughness.
June 29, 2007
I'll be on vacation next month. The next PowerPoint Tips Newsletter (and blog entries) will come out in August.
June 27, 2007
Understand the types of speeches
Before you can write and deliver an effective speech, you need to know what type of speech you're giving. Then you can make sure that the content and organization meet the needs and goals of the speech.
There are 4 types of speeches:
- Persuasive: Tries to convince the audience to accept your view or take a recommended action. Sales presentations are a typical example, but there are many others
- Informative: Provides the audience with new information or insights on the topic. A lecture by a professor to a class is informative.
- Inspirational: tries to uplift the audience. May have a spiritual theme.
- Special occasion: Offers appropriate content for a toast, award presentation, acceptance, introduction, eulogy, etc.
Before starting to outline a speech, think which type you're writing. I'll continue in future tips to elaborate on this topic, including ways to organize various types of speeches, effective techniques, and more.
June 23, 2007
Dissolve one image into another
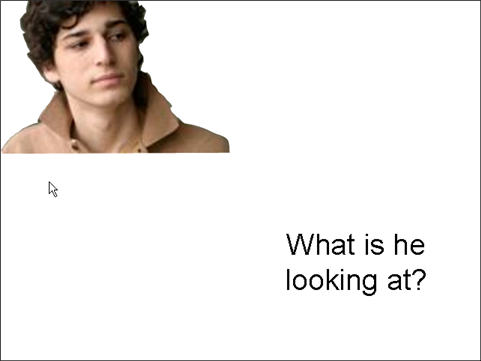
Dissolves are commonly used in video, but you can create them in PowerPoint, too, using the Fade animation. Recently, I gave a presentation on creating quizzes in PowerPoint, which included this slide.

I wanted to dissolve this image into another one that showed a presenter interacting more with the audience.

You could use two slides and a slide transition. (The Dissolve transition is too much like a checkerboard; the Fade Smoothly is better.) But then the text appears to blink, too.
Instead, I used one slide and put the first image on top of the second. I gave the first image an exit animation of Fade. Then, when I clicked, the first image faded out, showing the second image. I used a medium speed. You can view an AVI of the effect here. (But note that a movie is never as smooth as viewing the slide show directly.)
To assign an exit animation, select the object, choose Slide Show > Custom Animation. In the Custom Animation task pane., choose Add Effect > Exit, and one of the exit animation choices.
Don't the interacting people looking like they're having more fun?
June 16, 2007
Create a slide show that really slides!
Recently, it occurred to me that the words "slide show" came about because the first slides looked like they were sliding as the slides where moved on and off the screen.
Here's a technique that makes your presentation look as if it's sliding. It uses a combination of these features:
- The Push Left slide transition
- A background with no vertical borders
- One or two continuous horizontal borders
- Other optional horizontal elements

Here's how to get this effect:
- Apply the Push Left slide transition to all the slides. In PowerPoint 2002/2003, choose Slide Show > Slide Transition. From the list, choose Push Left. Make sure the speed is set to Slow; if not, the text will go by too fast for comfort during the transition. Then click the Apply to All Slides button.
- Apply a background with horizontal elements. I used a horizontal gradient. For the bottom, I found some clip art of books and copied it across the page, stretching as necessary to make it fit perfectly on the slide.
- Create a horizontal border on the top, bottom, or both. For the top, I used a simple rectangle, with no outline. I removed the outline to avoid having a vertical bar at the left and right side of the rectangle.
- Then I added a thin, white rectangle (also with no outline) below it.
The borders can be on the master or each slide. I used both techniques. If you put the top border on the master, it could be your title placeholder. Otherwise, add an AutoShape to each slide.
This presentation would work well with automatic timing, displayed on a screen in the company's lobby.
May 30, 2007
Web seminar: Creating Interactive Quizzes in PowerPoint
Wednesday, June 20, 2007
1 pm ET (12 Noon CT, 11 am MT, 10 am PT); 60 minutes
10% discount available!
Trainers, Presenters, and Educators: Give your audience a presentation experience they’re guaranteed to remember!
Click here now to get your discount code!
May 30, 2007

Last month we introduce PowerPoint, the PowerPoint conference coming up in October. Remember that you can get $75 off the conference price. Click here to get your discount code.
May 30, 2007
5 related backgrounds that you can customize with your own images.
These 5 backgrounds, which I call Curvy Sidebar, feature a photo or abstract image on a left, curved sidebar. I've created a presentation with 5 examples, but you can create your own. Find a photo or image. Then double-click a sidebar in the presentation to open the Format AutoShape dialog box. On the Picture tab, click the Picture button and choose your file. The image will fill the sidebar.


May 26, 2007
May, 2007 Resource of the Month - Internet4Classrooms (I4C)
Internet4Classrooms offers tutorials, lots of links (especially suited for education, but also general), game templates, sample presentations, and more.
May 22, 2007
Add notes during a presentation
It's not unusual for a speaker to need to write down notes during a presentation, especially in a meeting environment. For example, you might want to keep track of decisions made, actions steps to take (and who should take them), questions from the audience, and so on.
PowerPoint 2000 and 2002 contain two features to do this:
The Speaker Notes feature lets you add notes during a presentation. From slide show view, right-click and choose Speaker Notes. A dialog box opens, where you can type notes for each slide. These notes are automatically added to the Notes pane and you can see them afterwards in normal view.

The Meeting Minder feature (from slide show view, right-click and choose Meeting Minder) lets you take minutes and assign action items to individuals with a due date. You can view them later in PowerPoint from slide show view by opening the Meeting Minder again, or export them to Microsoft Word, where you need to save the document. Content on the Action Items tab becomes a separate slide, called Action Items.

I think these features are very useful, but Microsoft apparently doesn't. I assume that their research showed that people didn't use them. PowerPoint 2003 didn't include the Meeting Minder. Then PowerPoint 2007 removed Speaker Notes! You now need to return to pen and paper -- or do you?
The following technique comes from Sonia Coleman's site; the credit for this tip goes to her.
- Create your presentation.
- Insert a new slide at the beginning of the presentation; you can give it a title of "Notes" or "Minutes." This slide is now slide 1.
- Add a blank action button; the Action Settings dialog box automatically opens. Choose the Hyperlink To option and choose Last Slide Viewed from the drop-down list. Click OK. This will return you to your current slide when you're done entering notes. Type Return to label the button. (If typing doesn't work, right-click the button, and choose Add Text. )


- Choose Slide Show > Set Up (Slide) Show. In the Show Slides section of the dialog box, choose the From option and change the first number to 2. This starts your presentation at slide 2, so that the Notes slide never appears until you hyperlink to it. Click OK.

- Choose View > Toolbars > Control Toolbox. (In PowerPoint 2007, click the Developer tab. If you don't have a Developer tab, click the Office button at the upper-left corner, and choose PowerPoint Options. On the Popular pane, check the Show Developer Tab in the Ribton check box. Click OK.)
- Click the Text Box button
 and drag a rectangle on your slide with enough width to comfortably enter notes.

- With the text box selected, right-click and choose Properties to display the Properties sheet. Click the Categorized tab. Change the settings marked with arrows as shown here:

- Value: Provides pre-entered text if you want it. The Data item automatically changes to match the Value item.
- EnterKeyBehavior: Set to True so that pressing Enter starts a new line.
- MultilLine: Set to True so that the text box can have multiple lines of text.
- WordWrap: Set to True so that the text wraps if you enter a long line of text.
- Font: Choose a font that you're sure will exist on the computer you're presenting on.
- ScrollBars: Set to 2-fmScrollBarsVertical to display a vertical scrollbar when you add enough text.
Feel free to play with the other settings to see if they're useful to you.
- Close the Properties window by clicking its Close button.
- To make the Notes slide available from all other slides, open the slide master (View > Master > Master Slide; View > Slide Master in 2007) and insert the blank action button. From the Hyperlink drop-down list, choose Slide. In the Hyperlink to Slide dialog box, choose 1.Notes. Click OK. (You can't choose First Slide, because that's slide 2!) As you did earlier, add a lable such as Add Notes, or similar text. Close the Slide Master. If you want access to the Notes slide from only certain slides, add individual action buttons on those slides instead of on the slide master.

- If you want to use this presentation as a template for future presentations, save it and then save it again under a new name. Use the new presentation for now. You can go back to the first presentation and delete all the content from slides 2 on, so that it really works as a template.
- Test the presentation. When you open it in slide show view, it should start with slide 2. On any slide that has a button (all of them if you put the button on the slide master), click the Return Add Notes button to go to the Notes slide. You can enter text in the text box. When you're done, click Return to return to the previous slide you were on.
Because all the notes go on the same Notes slide, you may want to start each note with a notation about the slide you're working on, perhaps by entering its title.
If you add text to test the text box, you can always delete it in normal view.
After the presentation, when you return to normal view, you'll be prompted to save the file when you close it. Saving the file will save the notes.
Later, you can open the file in normal view. To copy and paste the notes, select the text box, right-click, and choose TextBox Object > Edit. You'll now be able to select the text, copy it, and paste it.
May 16, 2007
Photos make great backgrounds for slides, but you need to find the right ones. The secret to finding free photos is to know how to use Microsoft's tools effectively and where to look on the Web.
Find photos in PowerPoint
Many people don't know how to find photos in PowerPoint. In PowerPoint 2002 and 2003, do the following:
- On the Drawing toolbar, click the Insert Clip Art button or choose Insert Picture > Clip Art. The Clip Art task pane opens.
- In the Search For text box, enter a keyword to search for. For example, enter sky.
- Click the down arrow of the Search In drop-down list to specify where you want to look. You can leave Everywhere check box checked to look on your computer, in MS Office collections, and on Microsoft's Web site. (By including Web Collections, you'll also be searching Microsoft's Clip Art and Media site.
- Click the down arrow of the Results Should Be drop-down list. Here's the secret. Uncheck everything except photographs.
- Click Go and you'll get only sky photos.
Find public domain photos on the Web
You often see sites selling royalty-free photos, but you have to pay for them. That may be the way to go if you want the largest selection to choose from. But you can find lots of photos, especially beautiful nature photos, that are in the public domain. This means that you can use them for any purpose, private or commercial. You just can't copyright them, since they in the public domain.
One site with a great collection — and an excellent explanation of what public domain means and what to watch out for — is PD Photo.org. This site has gorgeous photos that you can use. Here's a beach picture:

The U.S. government has three sites with extensive collections of great photos:
- The National Oceanic and Atmospheric Administration (NOAA) has a great library of water photos. Here's an example:

You are supposed to give them credit as in, "Thanks to the National Oceanic and Atmospheric Administration/Department of Commerce." Of course, you don't want to do this on a photo that you use as a background for a slide, but you can do it on your last slide or in small print at the bottom of your first slide.
- The U.S. Fish and Wildlife Service's Pictures/Graphics site has lots of great photos and drawings. Here's an example:

The request a credit such as the following: Credit: U. S. Fish and Wildlife Service
- NASA has an extensive photo collection, but it's not very easy to search and many of the photos are taken for their technical characteristics, rather than their beauty. Nevertheless, you can find some great shots. The main site is at http://images.jsc.nasa.gov/.
Try their Earth from Space page. Here's the eye of Hurricane Ivan and a great photo of noctilucent clouds (they also explain what those are). They also want you to acknowledge NASA as the source (as I'm now doing).


Free photo sites
There are a number of other sites that offer free photos, with varying rules about how you can use them. Some are sites that let photographers contribute their own photos.
An excellent site is stock.xchng. This is a huge, well-trafficked site. You can upload your own photos, and find zillions that you can use. The site is easy to search, as well.
Another site is morgueFile. It oOffers free image reference material for use in all creative pursuits.
Flickr, which you've probably heard of, is another site that lets people contribute their own images. Many are simply personal photos, but you can still find some good ones.
May 2, 2007
Create a cascading animation effect
To create a cascading effect of objects entering quickly one after another, animate several objects with the same entrance effect. Here, I use the Appear effect for bulleted text.
Use a Start setting of With Previous for all but the first object. Then, click the animation item’s down arrow in the Custom Animation task pane, and choose Show Advanced Timeline. You now see orange rectangles representing the time covered by each animation.

Starting from the second rectangle, drag each rectangle a little further to the right, so that each animation starts slightly after the previous one.
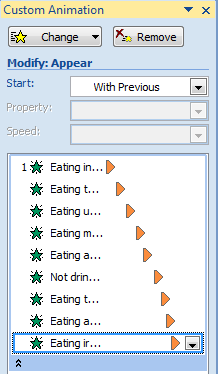
You can also click any item's down arrow and choose Timing to set the timing precisely in a text box.
April 28, 2007
April, 2007 Resource of the Month - Active Learning with PowerPoint
This University of Minnesota site includes an excellent tutorial on using PowerPoint in a way that engages students' interests. You'll find much applicable to business use as well. There's also a great section on games created in PowerPoint.
April 27, 2007
Web seminar: Creating Interactive Quizzes in PowerPoint
Wednesday, June 20, 2007
1 pm ET (12 Noon CT, 11 am MT, 10 am PT); 60 minutes
10% discount available!
Trainers, Presenters, and Educators: Give your audience a presentation experience they’re guaranteed to remember!
Whether you’re training staff, teaching students, or sharing corporate data, interactive quizzes provide a dynamic way to engage audience members and aid them in retaining the information. But if you’re worried that creating them requires complex and expensive software, we’ve got great news — PowerPoint gives you all the tools you need!
Join me as I show you how easy it is to create quizzes that improve learning outcomes and are fun as well. These quizzes are applicable to any field and usable in both education and business.
This webcast will show you several techniques for creating your own interactive, multiple choice quizzes in PowerPoint. Master the nuts and bolts needed to create right/wrong answer paths, clickable maps, personalized quizzes, and more! Here are just some of the topics I will cover:
- Use presentation techniques that engage and encourage quiz takers
- Turn any photo or drawing into an interactive teaching tool
- Enhance learning by requiring correct answers before users proceed
- Create self-paced quizzes to let students learn at their own speeds
- Personalize quizzes to individuals — it’s easier than you think!
- Provide immediate feedback for right and wrong answers
- Got a new product? Build an interactive guide that walks staff through each feature
- And much more!
PLUS: Get immediate answers to your Microsoft PowerPoint questions during the live Q&A session. It’s like having your own virtual presentation and PowerPoint expert on site!
This seminar is hosted by Eli Journals, the publisher of the monthly Inside AutoCAD newsletter.
The webinar is only a few weeks away, so register now!
Special Offer! Get 10% off the price of the seminar. At checkout, enter 10%OFFQUIZPOWER in the Enter Coupon Code box.Register at: http://www.audioeducator.com/industry_conference.php?id=341
April 27, 2007
Push PowerPoint charting options to the limit
 This article is by Rebecca Renner, President of Creative Minds, Inc., a 10-year-old graphic design firm that specializes in PowerPoint presentations and print collateral. Rebecca has more than 20 years of graphic design experience, including 10 years in corporate communications, handling writing and editing projects in addition to presentation and print design. She enjoys working closely with clients to help them meet their communication goals.
It’s easy to get frustrated with the limitations of PowerPoint’s charting tool. Creating charts solely using PowerPoint can result in data and graphs that are flat and dull. As a result, many a presenter has turned to Adobe Photoshop to create more robust charts.
Photoshop’s main appeal is its ability to create a chart image and make easy changes to any color, shape, size or opacity setting. In addition, Photoshop’s layers can provide much-needed depth to chart objects. If you use Photoshop, the end result is often a gorgeous chart. But despite the beauty of the design, Photoshop-authored charts have one major downfall — once the graphic is imported into a slideshow, it’s impossible to edit the chart’s data in PowerPoint.
Consequently, a last-minute change to slideshow’s chart requires that you go back into the original Photoshop-created document, edit it and resave it in Photoshop, then drop it back into PowerPoint. This process can be time-consuming, cumbersome, and frustrating when chart data has to be changed often. Is there a happy medium between the cookie-cutter charts of PowerPoint and the elegant creation tools of Photoshop? At the moment, presenters have two other options:
- Use third-party charting tools for PowerPoint
- Take advantage of PowerPoint’s own charting tools
The Third Wheel
There are several third-party programs, such as CrystalGraphics Charts plug-in, that can create a good- looking chart for use in PowerPoint, and most have the ability to edit the data later. This, of course, requires the receiver of the PowerPoint file (or anyone else who might need to make last-minute changes) to have the third-party charting software loaded on their computer to be able to edit the chart. Thus, the chart created with any of these tools has the same constraints as the PhotoShop-produced chart.
The other option, to explore PowerPoint's fill effects, is one worth considering.
Clean Fill
Within PowerPoint, the charting mode gives the option to use the Fill Effect to fill a chart with a gradient, pattern, texture or picture. Most people simply use a color fill or, perhaps, a gradient fill. This is one of the many reasons a chart created solely in PowerPoint can look dull and flat. Also, the pattern and texture fill options usually never display well so these effects rarely, if ever, get used. But the picture fill option can spruce up a chart in some unique ways.
By filling a chart with a picture, it is possible to create a chart that rivals the sleekness of a Photoshop-created image. Granted, with this method there will be some pixilation on a pie chart, but it’s a small sacrifice for the ability to re-edit data later.
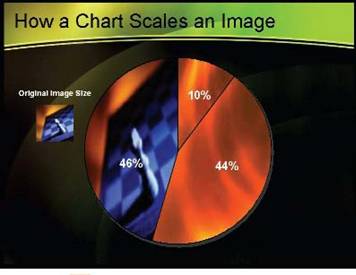
Within this fill effects option there are two ways to fill charts. You can fill the entire chart with one image, or fill any individual chart item with an image. No matter which option you choose, it’s important to carefully consider the image to be used. It’s not a good idea to use an image of a recognizable object, person or place because images will be scaled, skewed or distorted within a chart shape. Often this has the same result as using a poorly displayed pattern fill — it doesn’t benefit the look of the final chart.
More Filling Please
Once an image is selected, placing it within the chart is relatively easy. Here’s how:
For this example, we will fill a pie chart. Begin by creating a pie chart with data. To do so, choose Insert > Chart from the menu to bring up the chart creation menu and spreadsheet. After you’ve create a chart and placed it on the slide, double-click on the chart image to enter the chart edit mode. Once in chart mode, double-click again, but this time on the pie itself; the Format Data Series menu will appear. Select Fill Effects, then choose the Picture tab. Click Select Picture and browse to the target image on your hard drive. Click Insert, then OK, then OK again. This fills each individual piece of the pie chart with the same image. (See Figure 1.)
 |
| Figure 1: The image selected to fill the pie, and the end result. The whole pie chart isn't filled by one image; rather, each piece of the pie is filled with a scaled copy of the same image. (The image used is actually 400 x 400 pixels, but it could have been smaller or larger. Regardless of its size, PowerPoint will scale an image to fit.) |
Different Images for Different Pieces
In the second example, we’ll fill each pie piece with a different image. Follow the previous directions to get into the chart edit mode. Then, instead of double-clicking on the whole pie chart, single-click several times on one of the pie pieces until that piece only is selected. Then double-click; the Format Data Point window appears. Continue as before to add your image of choice. When this pie piece is filled, follow the same steps to fill each of the other pieces. (Figure 2 shows the three images we used to fill the pie pieces.)
 |
| Figure 2: By using complementary images (left), this chart allows each individual piece to stand out. |
The third example shows why a recognizable image shouldn’t be used to fill a chart or chart item, and how the image is scaled to fit into the piece of the pie. In Figure 3 the tiny image on the left is used to fill the largest piece of the pie. Note that although scaling makes the image fit the entire area, it also skews the image so that it’s almost unrecognizable.
 |
| Figure 3: Note the distortion of the object as it's scaled to fit the chart. Using object images within charts is not recommended. |
In the fourth example, we’ll see how this fill effect works with bar charts. As in the first example, create a bar chart with data, then fill the bars with the same image. In Figure 4, compare the image on the right with the actual look of the three bars. Note how each of the bars is filled with the entire image, but the image is scaled to the dimensions of the bar. Bar 1 is the closest to the original image because its dimensions are the closest to being a square.
 |
| Figure 4: All the bars are filled with the same pattern, but the scaling is different within each one due to height (dimension) differences. |
Figure 5 shows the same bar chart, but each bar is filled with a separate image.
 |
| Figure 5: Same chart as Figure 4, but uses differences in both scale and color. |
Figure 6 shows other fill options for bar charts. After creating and placing a bar chart, go to Fill Effects and find the Picture tab. From the Format menu within the Picture tab, the selected image can be stretched or stacked or you can even stack a number of images (actually using a combination of stretching and stacking).
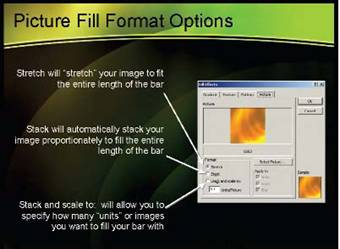 |
| Figure 6: Look to the Format section within the Picture tab to create stretching and stacking effects that also may benefit a chart. |
Figure 7 shows these three options in action. The red bar on the left illustrates Stack and Scale To. Note that the image used is actually squeezed and stacked because our “units/picture” value is less than 1.0 (we used a value of 0.7). The two bars under Stack show the differences between an effective stack vs. an ineffective stack. The image of our texture doesn’t work using the stack effect, but the dollar bags do. The final bar on the right simply shows Stretch . This example is the most effective use of our textured image.
 |
| Figure 7: The four bars show the Format section in action and the effects of stretching, stacking, and both. |
Some Final Points
Can you use these fill effects with 3-D charts? It can be done. We don’t recommend it, however. 3-D’s additional dimension often produces an effect that doesn’t look good for the overall chart. Using these effects with 2-D charts is usually more effective. Finally, don’t be afraid to play. Take the time to see what fill effects might work for your charts and what images you want to have on hand for last-minute changes. The end result is the ability to create a quick and easy chart that looks as professional as one created with Adobe Photoshop, but is editable from inside PowerPoint.
April 25, 2007
PowerPoint Live is the only conference dedicated to PowerPoint. There, you'll attend sessions with PowerPoint experts, meet other PowerPoint enthusiasts, and learn many tips and techniques to make your content, design, and delivery the best it can be.
And I have a great deal for you!
$75 off the price whenever you register plus
$100 off if you register before May 1st!
Read on. . .
You'll have lots of fun, too, at this laid-back, close-knit conference. Many people have been going for several years.
What do you get?
- The opportunity to speak with Microsoft employees responsible for creating PowerPoint
- Sessions on a wide range of PowerPoint topics given by top PowerPoint professionals
- A trade fair where you can try out third-party products that complement PowerPoint
- An excellent workbook, full of ideas and techniques to take home
- Great food and people!
Last year was my first conference and here are some of the pictures I took. I can honestly say that I learned a great deal and had a great time as well. I'm very much looking forward to the next conference in New Orleans. I highly recommend PowerPoint Live.
 |  |
 |  |
Don't delay! Remember, after May 1st, you pay an additional $100.
To get your $75 discount, click the banner at the top of this article or go directly to the PowerPoint Live site and register. At the end of the process, you'll see a Comments text box to enter your discount code. It's EF07. Enter this code in the Comments box and you'll get $75 of the conference price!
April 22, 2007
Animate a revolving earth
Here's a trompe l'oeil effect of the earth revolving. I learned this in Flash and have been trying to reproduce it in PowerPoint for a while. It doesn't look as nice in PowerPoint, because Flash's vector graphics are sharper, but it's still nice.
Look at the animation. (1.8 MB) Note that the AVI file isn't as smooth as the PowerPoint animation itself.
I think of this as a nice animation to show when the audience is entering the room, or during breaks. Maybe you can think of other uses.
Here's a static image of it.

Here are the steps:
- Find an image of the night sky and insert it onto the slide, resizing as necessary to cover the entire slide.
- Draw a large circle and center it on the slide. Remove the outline and use a fill color that doesn't exist anywhere in the photo. Red might be a good choice.
- Duplicate the circle and move the duplicate to the side for now. You'll need it later.
- Select the image and the circle, right-click, and choose Save as Picture. In the dialog box, choose the PNG file type, because PNG supports many colors and transparency. Save the image in the same folder as the presentation.
- Delete the image and the circle, or move them off the slide if you think you might need them again.
- Insert the PNG picture that you saved. Place it so that it completely covers the slide.
- Select the picture. (If the Picture toolbar isn't displayed, right-click any toolbar and choose Picture from the list of toolbars.) Then choose the Set Transparent Color button and click the circle shape. It becomes transparent and you should see the white slide through the circle -- which is now a hole.
- Move the duplicate circle that you saved and place it in the hole. It should fit perfectly; if you want, you can make it a little bigger than the hole.
- Double-click the circle to open the Format AutoShape dialog box. From the Fill drop-down list, choose Fill Effects and use the Gradient tab to change the fill to a black and white gradient, using the From Center type, with the white at the center and the black around the circumference. This gradient will create the illustion of a globe.
- Right-click the circle and choose Order > Send Backward.
- Now comes the hard part. Find a map of the world with blue oceans and green land. I modified mine in Photoshop. Make sure that there is space for the Pacific Ocean at one end. Then duplicate the map and group the two side by side. (I've included this map in the download at the end of this tip.) The height of the map needs to be just a little more than the diameter of your circle, so resize it if necessary. You need the result to be one image file. Insert it onto the slide, resize it, and then use the same Save as Picture command you used earlier to save it as a PNG file in the same folder as the presentation.

- Draw a rectangle the same size as the map. You can now delete the map image, since you saved it.
- Double-click the rectangle and remove the outline of the rectangle. In the Fill section, choose Fill Effects from the drop-down list and use the Picture tab to insert the image of the map that you saved. When you click OK and return to the Format AutoShape dialog box, drag the Transparency slider to 50%.
- Place the map to the right of the slide. Right-clic,, and choose Order > Send Backward. It should be behind the sky image, but in front of the black and white circle. Your entire setup should look like this. (Zoom to 25% to see it all.)

- Select the rectangle/map and choose Slide Show > Custom Animation. In the Custom Animation task pane, choose Add Effect > Motion Paths > Left.
- Select the motion path track drag, resize it so that it goes from the right side of the slide to the left side of the circle, as you see here.

- Click the Play button in the Custom Animation task pane to see that you're getting basically the right effect.
- Select the animation in the Custom Animation task pane and choose Timing from the drop-down list. From the Repeat drop-down list, choose Until Next Click and click OK.
- Save your presentation and go into Slide Show view to see the result. Do you see a jerk at each repeat? I did; go back and make minor adjustments to the length of the motion path until you get the smoothest possible result. (This is the really hard part!)
Download the presentation and the image of the map.
April 14, 2007
Inside secrets to making your visuals look professional
By Jim Endicott, Owner/Manager of Distinction

I'd like to think that the word "professional" still means something today. I want to believe that a professional carpenter would build a home with greater proficiency than a typical homeowner - a professional roofer would understand the tricks of laying down a 3-tab shingle better than most, and a professional auto mechanic has a better chance of fixing a nagging engine idle problem. The word professional still has meaning in many places today but we rarely equate professional and presentation design in the same sentence. Why?
I'm guessing that it has a lot to do with how we perceive the whole category of presentation graphics. In the 80's, expensive computer graphic service bureaus with custom computer workstations were one of the only sources of computer-generated artwork. There were few viable do-it-yourself options.
Then later in the 80s, PowerPoint 1.0 hit the scene with the promise that every businessperson could now wrestle control over that expensive process and become a "professional" designer in their own right. A template here, a placeholder there, throw in a few pieces of canned clipart and you had arrived as a presentation designer. In many business circles today, the process has never returned to the hands of design professionals and has become ad hoc, at best, making most presentation graphics painfully pedestrian in appearance.
I'd like to share some inside secrets about how true presentation design professionals view this whole process and the tools that support it. You won't typically hear these things from your administrative assistant or overworked graphics department because presentation design specialists look at the process through a different set of eyes. Here's what they've understood for some time.
- Look at PowerPoint as simply a delivery mechanism for message and graphics.
- Use external design tools to enhance the professional appearance of every image.
Can you image an Internet where every web site only used the low-end clipart that came with FrontPage? It's hard to imagine, but in many circles that's what we've done with presentations. When we tap into the power of Adobe PhotoShop (or similar bitmap editing packages) for designing background templates and integrating custom, photo-realistic imagery, PowerPoint begins to transcend its customary look and feel.
If the audience's first impression is "oh, another PowerPoint presentation", we know that there are telltale signs that we've taken the path of least creative resistance. If they are impressed with the visual communication tool and have momentary doubts about how it was created - you are starting to succeed as a designer. We don't define our end product by the tools we use and neither should they. Traditional rectangular photos airbrushed subtly into the background can create powerful impressions. Gone are the hard sharp edges that betray the fact that we've dropped in a quick and dirty photo.
- Don't let the software tools dictate how you layout information.
Can't get the placeholder to do what you want? Copy/paste a number of text blocks and lay in custom text elements exactly where you want them to go. Use the alignment tool to create perfect pixel alignment from slide to slide. Don't like line spacing? Change it. Tired of bullets for every line of text? Then think more critically about what the bullets are saying. Perhaps the first line of text is describing the rest and should be subtitle or non-bulleted treatment.
Most professional presentation designers do not use PowerPoint's charting features because they can only produce extremely basic, predictable charts. Could you imagine a PowerPoint chart being used in USA Today or in an annual stockholders report? The answer is no. Just like a professional presentation designer, charts are custom created within the context of what the chart is trying to describe. It doesn't always take a lot longer to do, but it always conveys a more powerful impression. And remember, simpler is better when it comes to conveying quantitative information.
- Raise your expectations for the use of animation, then make the tool emulate those ideas.
- Choose professional imagery to support a professional presentation.
Choose your supporting imagery carefully - those choices are a dead giveaway as to your professional skills. Jaggy artwork, gif files stretched to their limit or badly composed or lit photographs would not be tolerated in a professional visual communication tool but frequently accepted at the amateur level.
Inexpensive stock libraries for photos and logos exist. Marketing departments will often provide you with a good logo on request but you have to take the initiative. Clipart is too informal for most external presentations. Select your images as if you or your presenter were going to be delivering the presentation in the national spotlight.
I'm not unsympathetic to the plight of those who are constantly creating presentations on impossibly short time frames. I don't overlook the fact that not everyone has a significant level of expertise with tools like PhotoShop to leverage its design capabilities in PowerPoint. Some internal presentations simply don't merit the extra time and energy it will take to step up that presentation to the next level.
But for many presentations today, the stakes simply require more of us as presentation designers than simply the easiest and quickest approach we can find. It means taking back control of a process that has normally driven us. For many, it will begin to demand skills that they may not possess today but will be required of them tomorrow as our presentation graphics raise to the same level of importance as our other professional communication tools.
Maybe the problem is that many presentation designers don't want to see themselves as professionals. There's certainly an expectation that goes with that label but over the years I've met plenty of graphics department pros who understand and have set themselves apart with their expertise. They are partners in the process with the presenter because they breathe life into flat content and make the presenters look good. Perhaps it's even time for some presenters to let go of the creative process and put it back into the hands of the "professionals" in their companies.
April 7, 2007
Collect information or feedback
Have you ever wanted to collect information or get feedback from people who view your PowerPoint presentation on their own? You might have a self-running presentation at a convention or in the lobby of your organization. You could ask them if they liked the presentation and get comments, or you could even collect names and e-mail addresses of people who want more information.
While accomplishing this requires some programming, I recently discovered an article that made it easy enough for a non-programmer like me to get the job done.
The Microsoft Office PowerPoint site has a series of articles on ActiveX controls. Here's their definition of ActiveX controls:
"ActiveX controls include scroll bars, command buttons, option buttons, toggle buttons, and other controls that you use to create custom programs, dialog boxes, and forms."
One of the articles is called, "Become a feedback guru using ActiveX controls." This article runs you through the steps to create a slide like this:

Tip: The article doesn't explain how to change the size of the font. In the Properties box, which the article describes, click the Font item, then click the Ellipsis button that appears. Then you can specify a font, font style, and font size. Another technique that the article doesn't explain is that you can resize each control, just like you resize any object on a slide.
Viewers can then fill out the survey in slide show view, as you see here:

When they click Submit, they get a thank-you message.

Nice, isn't it?
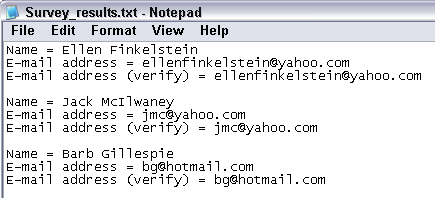
The result is a text file, named Survey_results.txt, that is created in the same folder as the presentation. Here's a sample:

What was unique about this article, in my view, was its clarity and the simplicity of the code. Because it was so simple, I was able to modify it to create a different type of slide, one that collects names and e-mail addresses.
(I have a similar technique in my book, How to Do Everything with Microsoft Office PowerPoint 2003 and 2007, which saves data to an Excel spreadsheet. However the code for that technique is more complex.)
Using the technique in this article, h ere's what my slide looks like:

Note that my slide doesn't use any new controls. It uses labels, text boxes, and a button like the original slide, but doesn't use any option buttons. So I didn't have to figure out anything new.
Here's the resulting file (with made-up e-mail addresses:
In order to understand how I did this, you need to read the article that I referenced above. Once you've gone through it, look at the code below, which is a modification of the code in the article:
Private Sub CommandButton1_Click()
'Purpose: Creates a text file and stores the survey results
'in the text file.
'You must set a refernce to the Microsoft Scripting Runtime
'(Tools menu, References command, check the Microsoft Scripting
'Runtime box, and then click OK).
Dim objFSO As Scripting.FileSystemObject
Dim objTS As Scripting.TextStream
'Create the text file
Set objFSO = New Scripting.FileSystemObject
Set objTS = objFSO.OpenTextFile(CurDir & "/Survey_results.txt", ForAppending, True)
' Write the results to the text file and then
'close the file.
objTS.WriteLine "Name = " & Me.TextBox1.Text
objTS.WriteLine "E-mail address = " & Me.TextBox2.Text
objTS.WriteLine "E-mail address (verify) = " & Me.TextBox3.Text
objTS.WriteBlankLines 1
objTS.Close
'Thank the user.
MsgBox "Thank you. We'll send you more information shortly."
'Clear the results for next time.
Me.TextBox1.Text = ""
Me.TextBox2.Text = ""
Me.TextBox3.Text = ""
'Return to beginning of presentation for next viewer.
ActivePresentation.SlideShowWindow.View.First
End Sub
The next-to-last line is something I added to move the presentation back to the first slide so the next viewer can start at the beginning, but you don't need to add this line.
I hope that you can modify this technique for your own situation.
March 24, 2007
This background, which I call Keylines, uses a fine line next to an Autoshape to create a professional look.


March 24, 2007
March 2007 Resource of the Month - Maniactive
Maniactive is Laura Bergells' website includes free templates, backgrounds, and links. Her Maniactive blog is full of backgrounds, and lively, useful advice
March 24, 2007
Life after death by PowerPoint
Comedian Don McMillan delivers a hilarious bash on PowerPoint in this 4-minute MySpace video, called Life After Death By PowerPoint. The audience seems to know just what he's talking about, and you will too.
At the same time, McMillan delivers a lesson about what not to do, so you'll learn something as well.
Thanks to Laura Bergells who linked to the video in her worthwhile Maniactive blog.
March 17, 2007
Add relevance with layers of meaning
When you deliver a presentation, you generally use a linear structure, which means that you tell a story, slide after slide, from beginning to end. However, people in the audience have to know how your story relates to them, why each point is important to their needs and wants. You can also inspire and motivate people by explaining how your message relates to the bigger picture, whether that means their entire company, industry, country, or the world.
A standard sales technique is to explain benefits rather than features because benefits relate to what an individual can gain from a product or service. Nevertheless, let’s say you’re selling an expensive server computer. You can’t simply tell your potential clients that this server will be easier to maintain, cost less over the long run, and run faster. They will want to know why and how, so you’ll need to explain the server’s features in detail.
The value of relevance
Your sales presentation can go further by relating the value of the server to your clients’ overall company needs, which include meeting the competition, keeping costs down, keeping up with new technology, serving its customers effectively, and so on. You can even inspire your clients by providing a vision of the future of server technology in our society.
A sales presentation is not the only type of presentation that needs to be relevant to an audience. Are you training employees? They want to know why each item that they have to learn is important to them as well as to the company. Summarizing a project or quarterly results? People want to know what it means and where it’s going. Any presentation will be improved by explaining the relevance of the content to the audience.
But how do you explain both features and benefits, without going way over your allotted time? How do you explain the importance of a training session without distracting employees from your salient points? How do you add levels of relevance without adding confusion, increasing length, and sounding repetitive? After all, you don’t want to repeat yourself over and over.
Create layers of meaning
It seems that you need to create two parallel presentations that run at the same time—one presentation explaining the features of your product, service, course, or summary and the other, either simultaneous or intertwined with the first, explaining the benefits and relevance. On one hand, this sounds obvious. You want your audience to understand the relevance of your points as you deliver them. On the other hand, it sounds terribly complicated!
You can use several techniques to create parallel meanings throughout your presentation, without increasing the length very much. But before you start, of course you need to think about these multiple messages and how they apply to your presentation.
I’ll use an example of a presentation given by a consultant on the usability of a company’s Web site. The consultant used test subjects to look at the site and recorded their answers to questions, how they completed given tasks, and their overall impressions. In this case the consultant needs to report on the results of the testing process in detail which means explaining test subjects’ responses to specific pages.
However, the consultant wants the company to understand three important points throughout the presentation—visual impressions, navigation, and unclear text all lead to confusion, dissatisfaction and, more importantly, fewer purchases. On a wider scale, the consultant wants to emphasize the importance of the Web site for the company’s overall business strategy. Therefore, the consultant now has three levels of meaning to impart—the specifics of the usability testing, the placing of each specific into one of three categories, and a broader message about the importance of the Web site itself.
Provide an overview before diving into details
You should give your audience an overview of your presentation before you start getting into the nitty-gritty. This concept falls into the “tell ‘em what you’ll tell ‘em” principle. An overview lets your audience know what you’ll cover so that the details can fit into place more easily. They’ll understand and remember your presentation better with an overview.
In the overview or at the beginning of the presentation, you can discuss the various levels of the presentation in detail. In our example, the consultant can explain the importance of the Web site for the company and how poor usability therefore affects the company’s bottom line. In this slide, you can see some points that explain the importance of the Web site for a company. (I used a background from a Digital Juice collection that portrays a computer screen—appropriate for this topic.)

At the same time, the consultant can break down usability problems into the three categories and explain them thoroughly. Here you see an example of a slide that covers these categories.

Create a mechanism for multi-threaded content
One way to relate the presentation’s content to another level of meaning is to organize the presentation by the categories of meaning. In the example presentation, the consultant can simply organize the presentation according to problems of visual impression, navigation, and lack of clear text. By clearly marking each section with a title slide at the beginning of the section or by marking each slide with the section name, the audience will automatically connect each problem with one of the three categories.
Such an organization is not always possible. Perhaps the consultant wants to discuss one page at a time, although a page might have all three categories of problem. It might be necessary to cover the site according to the site’s organization so that the audience can more easily follow along.
A second method is to use color coding or icons for each category. At the beginning of the presentation, when explaining the three types of problems, the presentation can introduce a color or icon next to each item. By pointing out this mechanism, the consultant can make this connection clear to the audience. From that point on, the presentation can display the appropriate color or icon next to the point being discussed and the audience will understand. Here you see an example using icons. You can use these icons throughout the presentation to indicate the category of usability problem you are discussing.

The final method of integrating levels of content is more complex graphically, but more open to your creativity. You can visually show the levels, perhaps using shadows or 3-D images, to create the illusion of layers on the slide. In the example presentation, you might add a photo of a person, representing a user of the Web site. By adding a shadow, the photo would appear to be in front of the text. The person might appear confused, annoyed, or even angry, depending on the usability problem being discussed.
For a sale presentation, you could use a happy customer (or a happy accountant) to show the connection between your product’s features and the company’s need to better serve its customers (or save money). In each case, you are relating the presentation to its real-life implications, because what you are saying will have effects on real people. Here you see an example of this technique. By placing a confused or annoyed Web site user in front of the text, you relate the content of the slide to real users who are sitting in front of their computer using the company’s Web site.

Explain the big picture
You may decide to leave the level of the big picture to the beginning and the conclusion of your presentation. However, if this point is important for your presentation, you can use techniques similar to the ones I just discussed. Don’t create too many icons, colors, or levels—your audience can only remember so much. If you can integrate one level of meaning throughout the presentation and another with an overview, you will add a great deal of depth.
Summarize
When you summarize at the end of your presentation, you bring all the levels together. You repeat the points of your overview (“tell ‘em what you told ‘em”) and reiterate the relationship of all the details to your three main categories. Summarizing ties everything together and cements the relationship of the presentation’s content to the audience and the company.
March 5, 2007
Use feedback to complete the communication cycle
Your presentation will be more successful if you understand and utilize basic concepts of communication. If you leave out any aspect of the process, your communication may fail.
Several theories of communication exist, but here's my way of looking at it. (This type of diagram is easy to create with PowerPoint 2007's SmartArt.)

Step 1: The sender expresses the message
The first step in the process of communication occurs when the sender expresses a message. Communication always has a purpose, goal, or objective. If you don't know what that is, you can't express the message clearly. Common objectives are:
- To motivate (to work harder or smarter)
- To inform (about the results of a process or facts needs to make a decision)
- To teach
- To persuade (to make a certain decision, to buy a product)
- To entertain
- To inspire
You could separate the sender from the message and make this two steps.
Step 2: The medium transmits the message
The sender uses a medium to transmit a message. Media can be oral or written. It can be physical (printed matter), electrical (television), or electronic (e-mail). Media can be in words or images. When you deliver a PowerPoint presentation, you're using oral and electronic media of transmission, usually with both words and images.
For best communication, you want to choose the best medium. Sometimes, PowerPoint is not the best option. I've seen cartoons about a young man proposing marriage to a young woman with a PowerPoint presentation. "Nice PowerPoint, but no." You get the idea.
Step 3: The recipient interprets the message
Ay, there's the rub. The people who hear the message don't always interpret it the way you'd like. In fact, ask three people what they heard at a presentation and you'll get three different answers.
What do you do?
First, you construct and deliver the message with the audience in mind. What do they want to hear? What do they need to hear? How much do they already know? What perspectives do they bring with them? In other words, you need to craft the message for the audience.
Second, you try to remove any obstacles to clear understanding. In communication theory, this is often called noise. Noise can be any of the following:
- Distractions, such as an overly exciting or irrelevant background on your slides
- Discomforts, such as hard chairs or a cold room.
- Prejudices that people bring with them. You may need to state your assumptions or explain why certain assumptions are not valid.
Finally, you get feedback.
Step 4: Feedback returns the interpretation of the recipient to the sender
Feedback ensures that the recipient understood the message by sending the recipient's interpretation back to the sender. The recipient becomes the sender and the sender becomes the recipient, completing the communication loop.
When you deliver a PowerPoint presentation, you get feedback by asking for it. You can have a question and answer period, ask for opinions throughout, or include a feedback form in a handout. Note that if you do the latter, you won't be able to start the cycle again right away. Instead, you'll have to initiate a later round of communication (such as an e-mail) to correct any misunderstandings.
Depending on the circumstances and your objective, you may be able to create a discussion after the presentation to allow ideas to move among the audience members as well as between them and you.
In an educational setting, you might think that the exam is the feedback, but you don't want to wait until the test to find out that the students didn't understand the lesson. So teachers should also ask for questions to allow for on-the-spot clarification.
The important point is that you should use feedback to restart the cycle. Did someone misunderstand a point? Then explain it again in different words. See if the feedback is more accurate the second time.
If you follow these steps, you'll go far toward becoming a great communicator.

1 komentar:
Well, this I call sufficient :)
If you need a pre-made PowerPoint templates for your experiments with PowerPoint, try this site http://www.poweredtemplates.com/free-ppt-powerpoint-templates.html.
Posting Komentar